15 Sep Firing up my career in data journalism
A lot of tools and skill go into creating a cutting-edge multimedia investigation, as Tricia Govindasamy discovered when covering our Fire Factories feature
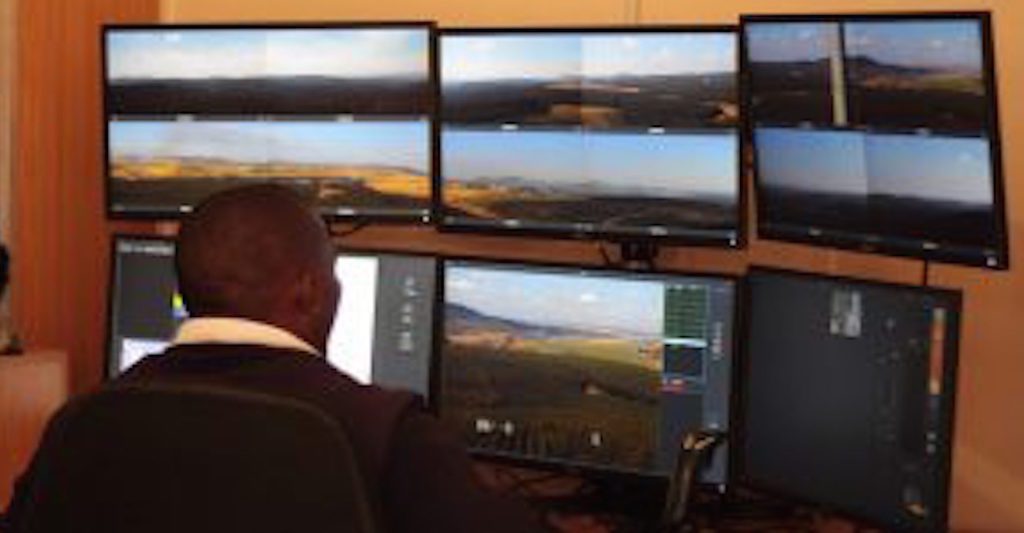
FireHawk is the first computer-assisted fire detection system in the world
In June this year, I joined Code for Africa as a Data Fellow and Research Assistant for its Pan-African Data Journalism team, StoryLab. Just as I just started dipping my feet into the world of journalism, Oxpeckers offered me the opportunity to undertake my very first multimedia investigation. Having studied environmental geology, my interests lie within environmental journalism and hence I jumped at the opportunity.
We produced a climate change adaptation investigation, entitled Fire Factories, that showcases a high-tech computer-assisted fire detection system being deployed in a rural community in KwaZulu-Natal.
Getting into journalism is starting from scratch for me. I planned my trip to the site as meticulously as I could because the trip to Richmond is about two hours’ drive away from my base in Durban. I wrote down all the questions I wanted answering and important features I wanted to capture on camera.
Fortunately for me, I made the best acquaintance I could have. Terry Tedder from the Richmond Fire Protection Association was ever so helpful in assisting me, welcoming me and the visual team to his office and taking us to the Nhlazuka community for interviews. His insights into the fire industry were also a tremendous help.
Lessons in data viz
After my site visit, I worked on the text before I got down to my favourite part: the data and visualisation.
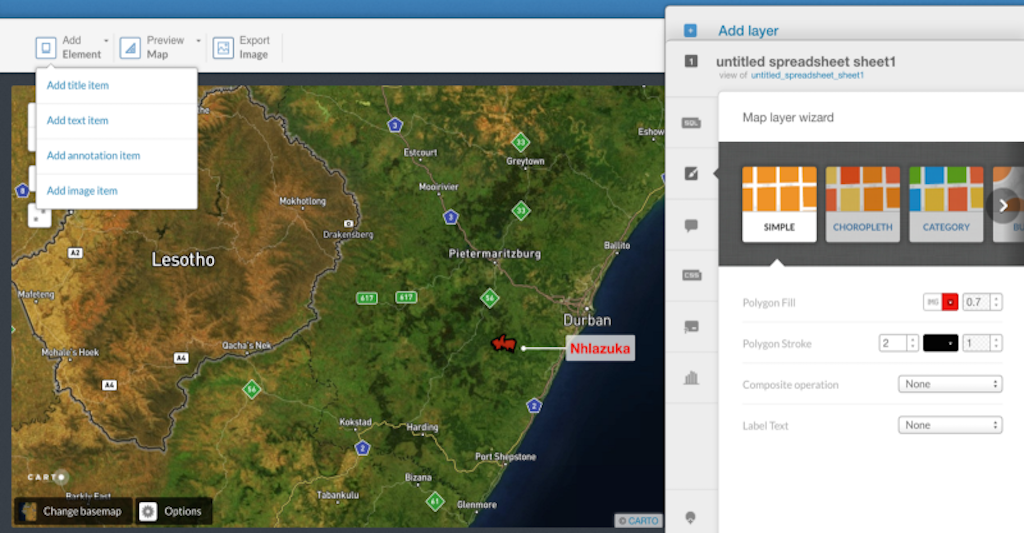
The fire early warning system is being deployed in the Nhlazuka community in the Richmond Local Municipality. The project is being funded by the uMgungundlovu District Municipality. All the names are quite confusing to absorb in one read, so the Oxpeckers editor suggested I create a map highlighting the location of Nhlazuka.
To create this map, I visited the Municipal Demarcation Board website and downloaded the uMgungundlovu District Municipality ward shapefile. I uploaded this shapefile to CARTO — a mapping platform — and removed all the entries except for Nhlazuka (ward 5) of Richmond Local Municipality. To highlight Nhlazuka I used a simple fill and labelled it using the “Add an annotation item” option.
What I learnt is that not everything makes the cut. I obtained fire location data for South Africa from the National Aeronautics and Space Administration (NASA) Fire Information for Resource Management System (FIRMS). I created a map using CARTO that displays a time lapse of the fires each month from November 2000 to June 2017. Unfortunately, the functionality of the map was problematic and did not end up making the publication. If you would like to view this map, click here. Nevertheless, it was a fun task to obtain the data, clean it and visualise it. This was the biggest dataset I have ever worked with, containing over 700,000 records.
The data visualisations for the piece were created on Atlas — a visualisation platform funded by the Code for Africa’s Innovate Africa fund. Atlas allows for simple visualisation, focusing on usability on desktop and mobile. I obtained very interesting statistics of incidents and corresponding rand damage for grass, bush and rubbish fires for 2003 to 2015 from the Fire Protection Association of Southern Africa.
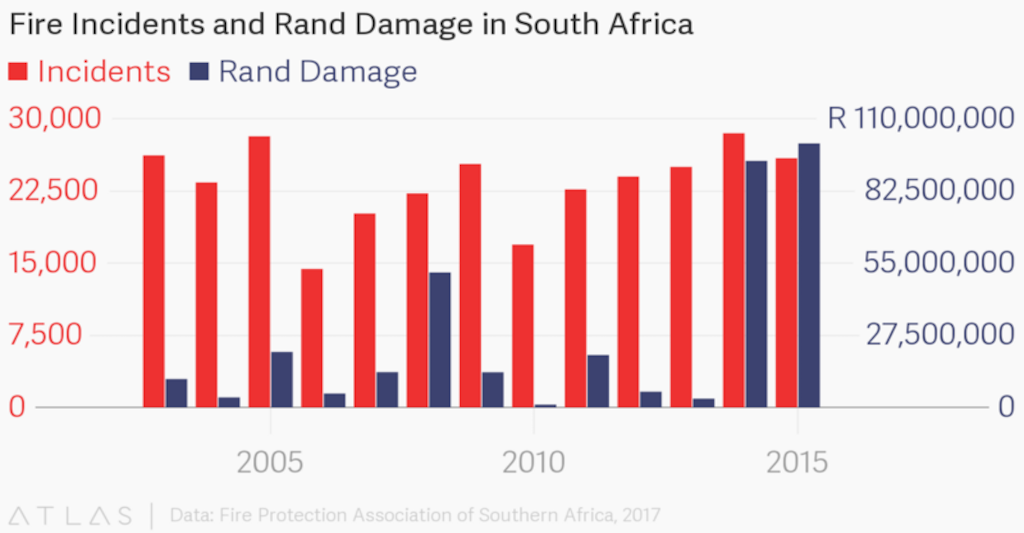
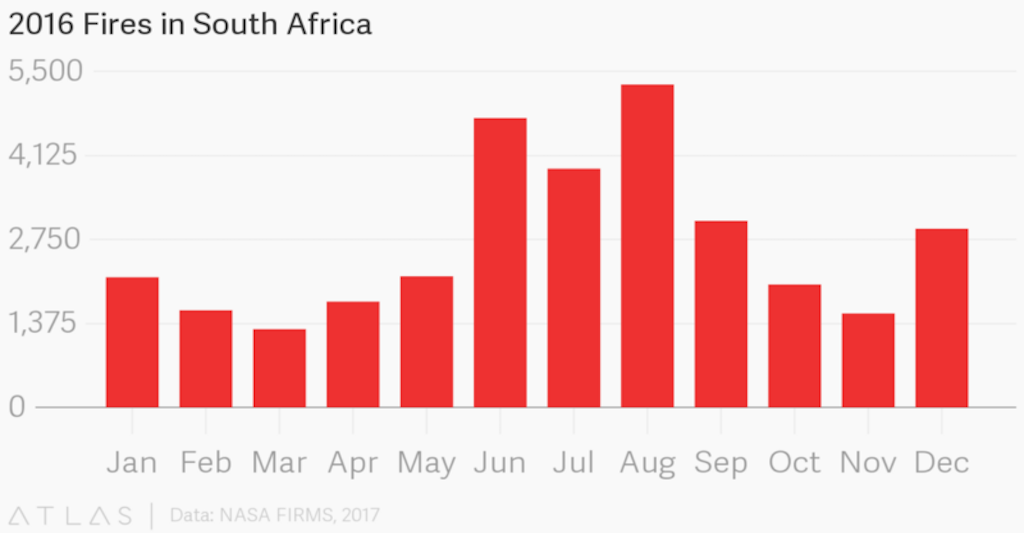
I also filtered the NASA FIRMS data and obtained monthly fire incidents for 2016 and created a visualisation. The data proved that August is fire season in South Africa, that fire incidents are increasing and the associated costs are rising.
Adding value with multimedia
Fortunately, this project has many partners who were helpful in sharing data, video and photo footage. I visited the FireHawk early warning detection centre in Richmond and experienced first hand the system at work. FireHawk and Working on Fire shared useful footage for the multimedia piece.
I also worked a bit with video editing for the feature. Community member Bono Cwazibe pointed to the valleys as he spoke about fires in the area. I wanted to showcase this in the feature, so I trimmed the footage into segments. I then created a simple video using Adobe Express.
Terry Tedder also shared his insights, but the footage was just of him in his office and adding a video didn’t provide much value. Instead, I decided to use just the audio interview with him. To do this, I used VideoPad and unlinked the video from the audio. I then trimmed the audio and added a fade in and fade out so the audio was not abrupt. I saved the audio file and uploaded it to soundcloud with Terry’s photo.
Finally, once all the data was collected and visualised, all research and interviews done, the feature was put together on shorthand — a drag and drop visual storytelling platform (perfect for non-coders).
Our goal was to create a multimedia feature which could be easily adapted to various other platforms, so it was decided to create a clean and neat, flowing piece without any animations. I had to ensure that the feature contained all its multimedia components while still having enough focus on the text. The feature also made it to print! It was published in The Witness on August 25.
Entering a new niche is quite daunting. I am lucky that I am passionate about the environment and using data and technology to solve environmental issues which make my tasks very rewarding. I am also very fortunate to have mentors such as Fiona Macleod at Oxpeckers and Jacopo Ottaviani, the StoryLab team lead, cultivating my skills.
Fire Factories is part of a series for the ImpactAfrica Fund titled “ClimaTracker: what climate change means for your town”, which focuses on how local neighbourhoods survive disruption by global climate change.
Find more Oxpeckers News on our Medium blog page