01 Mar ClimaTracker: Can you afford to eat?
What does climate change mean for the average household? Our new ClimaTracker Food Basket Calculator shows the costs in real terms

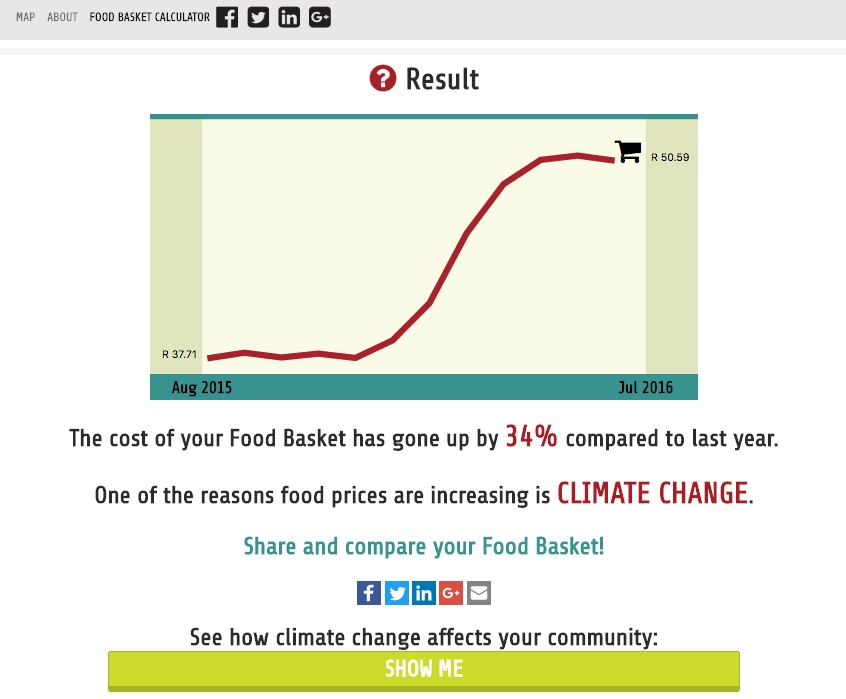
The cost of maize meal, Southern Africa’s staple food, rose by 34%
Food security is one of the biggest worries caused by climate change, as temperatures rise and extreme weather plays havoc with agricultural production.
What does this mean for the average household? Our new ClimaTracker Food Basket Calculator shows the costs of climate change in real terms.
This innovative mobile app demonstrates the impacts of climate change on your pocket as farm and crop prices rise.
It is a gamiefied user experience that brings the message home:
• It’s getting hotter: Southern Africa warms at twice the global rate, and the environmental and socio-economic consequences are devastating.
• Climate change threatens agriculture, and thus food security and the cost of food for everyone.
Users calculate their average food basket costs, based on monthly updated urban food price data from the National Agricultural Marketing Council and Stats SA.
ClimaTracker selected items from the forms of land agriculture in South Africa that are most affected by climate change. Users select one of each item they are most likely to purchase within a month in order to get an idea of how much crop and animal product costs have increased over the year.
Innovative geojournalism
The Food Basket Calculator is the latest innovation from ClimaTracker, which uses interactive maps and geojournalism to make complex climate-related data accessible to all users.
With the effects of climate change already observable, we work with our readers, civil society and government entities to inform vulnerable communities and to assist in strengthening their responsive capacity by reporting on both good and bad adaptive practices for building resilience.
Our temperature timeline shows how much average temperatures have changed and are likely to change in future, based on climate modelling data generated by researchers at the Council for Scientific and Industrial Research. Scrolling through the timeline shows which areas in Southern Africa will get hotter and hotter.
The farming maps show how these temperature increases are affecting the average yearly primary production in different parts of South Africa over the next 100 years. Primary production refers to the vegetation produced in an area, and the values are based on a climate model called ACRU developed by Professor Roland Schulze at the University of KZN.
All this information is useful for journalists reporting on climate change, adaptation and food security. ClimaTracker’s latest investigation used data from the platform to explain why rooibos farmers are going wild to survive.
Read our climate change investigative data journalism in the ClimaTracker Investigations dossier here.
ClimaTracker would like your feedback on our new features. Please take two minutes (or less) to fill in our survey here.
As with any digital tool, we need feedback to keep improving the tool and make sure it remains relevant and useful to our audience, which includes journalists, academics, NGOs, environmentalists and the general public. It would be incredibly valuable to us if you could let us know what you think of the tool – any constructive criticism or positive feedback is welcome.
ClimaTracker is a project of Oxpeckers Investigative Environmental Journalism, supported by Internews Earth Journalism Network and developed by ScienceLink
